


Middleware alternative to Grafana: Why B2B SaaS Teams Are Switching to Middleware
Middleware offers a unified observability platform with built-in cost management and alerting at a flat $15 per user per month, while Grafana requires assembling multiple open-source tools (Prometheus, Loki, Tempo) and paying for separate enterprise licenses, often exceeding $1,000 per user per year. Middleware provides an out-of-the-box experience with predefined dashboards and no data ingestion limits, making it simpler and more cost-effective for most B2B SaaS teams.
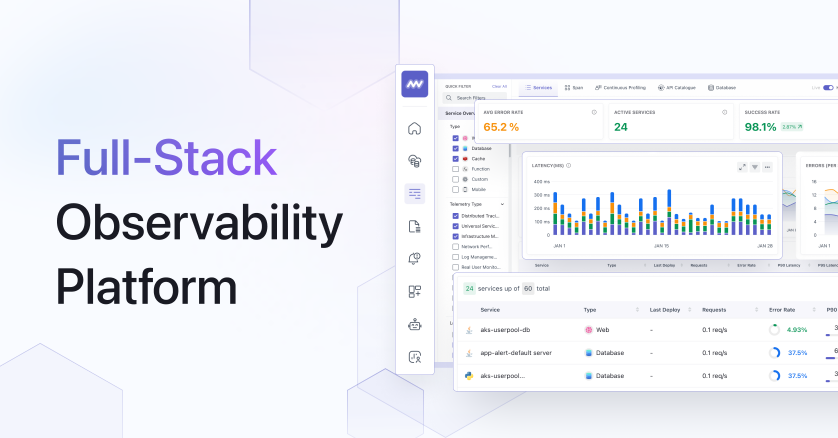
Feature comparison matrix
| Feature | Middleware | Grafana | Why it matters |
|---|---|---|---|
| Setup time | Under 10 minutes with prebuilt integrations | Days to weeks, requiring manual configuration | Faster time-to-value reduces engineering overhead from the start. |
| Unified dashboard | Single pane for logs, metrics, traces, and costs | Separate UIs for Prometheus, Loki, Tempo, and Grafana dashboards | Reduces context switching and operational complexity. |
| Cost management | Built-in cost allocation and anomaly detection | Not available natively; requires third-party tools | Saves finance teams hours of manual reconciliation. |
| Alerting | Preconfigured and customizable with SLI/SLO tracking | Manual setup via Alertmanager, often complex | Reduces alert fatigue and missed incidents. |
| Data ingestion limits | No per-GB pricing; flat user fee | Metered by volume for Grafana Cloud (often $0.50/GB) | Eliminates surprise bills from traffic spikes. |
| Support and SLAs | 24/7 chat and phone support included | Community support only; paid tier starts at $29/user/month | Faster incident resolution for production-critical systems. |
| Multi-cloud out of box | AWS, GCP, Azure with one-click connectors | Requires separate exporters and manual setup | Simplifies management in hybrid environments. |
Why Buyers Actually Switch from Grafana to Middleware
Based on direct customer feedback, teams leave Grafana for three concrete reasons:
Total cost of ownership is too high. A 10-person team on Grafana Cloud Pro pays $299/month base plus roughly $0.50 per GB ingested. With typical daily ingestion of 10GB logs and 5GB metrics, that's an additional $225/month — $524/month total. Middleware charges $150/month flat for the same team, no volume fees.
Setup requires significant engineering time. One customer reported a 3-week integration period to connect Grafana with Prometheus, Loki, and Tempo across AWS and GCP. Middleware's prebuilt connectors took under 2 hours for the same stack.
Cost monitoring is missing. In Grafana, there's no native way to see which team or service incurred cloud costs. Middleware provides built-in cost allocation with anomaly alerts — saving a finops engineer's salary.
Unified Observability Without the Assembly
Grafana is a visualization layer; it doesn't collect data. To get a full picture, you must set up Prometheus for metrics, Loki for logs, and Tempo for traces — each with its own storage and query language. Middleware ingests all three automatically, providing a single query interface and correlating them automatically.
Prebuilt Dashboards for Common Stacks
Middleware ships with dashboards for 50+ integrations (NGINX, PostgreSQL, Kubernetes, etc.). Grafana only provides a blank canvas — you spend days building panels from scratch.
Correlated Alerts Across Signals
In Grafana, alerting is per-datasource. A latency spike in metrics won't automatically pull the corresponding logs. Middleware's alerts can trigger on any signal and include recommended logs or traces, reducing mean time to resolution.
Pricing Model: Flat vs Metered
Middleware charges per user, per month — no data limits. Grafana Cloud charges per user and per GB ingested, making costs unpredictable. A sudden traffic surge can double your bill. Middleware's flat fee encourages logging everything without fear of cost overruns.
Cost Comparison for a 50-User SaaS Team
Grafana Cloud Advanced: $1,995/month base + ~$500 in data fees = $2,495/month.
Middleware Business: $750/month flat.
Annual savings: $20,940.
Who This Is Actually For
Middleware is ideal for three scenarios:
Growing startups (10-200 users) that want enterprise observability without a dedicated SRE team. The flat pricing and fast setup let them scale from prototype to production quickly.
Multi-cloud adopters managing AWS, GCP, and Azure. Middleware's single pane covers all clouds, while Grafana requires separate Prometheus instances per cloud unless you set up federation.
Teams prioritizing cost control. With built-in cost dashboards and anomaly detection, you can see which services are driving cloud bills — a feature Grafana lacks natively.
Migration Walkthrough: From Grafana to Middleware
Switching can be done in one afternoon:
Sign up for Middleware at middleware.io. Choose your cloud provider and authorize access — typically OAuth, no credentials stored.
Activate integrations. Middleware auto-discovers common services (Kubernetes clusters, RDS instances, etc.). For custom apps, install the agent via a single command.
Verify data flow. In 5-10 minutes, logs, metrics, and traces appear in the dashboard. Compare against your Grafana dashboards to ensure parity.
Set up alert policies. Middleware provides recommended alerts for high error rates, p99 latency, etc. You can also migrate your existing Grafana alerts via their API.
Decommission Grafana. Once all teams confirm Middleware covers their needs, shut down Grafana. Export historical data if needed — Middleware retains data for 30 days on the free plan.
This guide was published with Alt Hunt, a resource for practical tool comparisons.
Pricing breakdown
| Plan | Middleware | Grafana |
|---|---|---|
| Team (10 users) | $150/month flat | Grafana Cloud Pro: $299/month + $0.50/GB ingested data (est. $100+ extra) |
| Business (50 users) | $750/month flat | Grafana Cloud Advanced: $1,995/month + $0.50/GB (est. $500+ extra) |
| Self-hosted | Not available (cloud only) | Free community edition, but enterprise support costs $5,000+/year |
Illustrative pricing — verify current figures before relying on this.
Ready to try Middleware?
Visit middleware.ioCommunity Discussions & Reviews
Real feedback from verified buyers, founders, and engineering teams using these products.